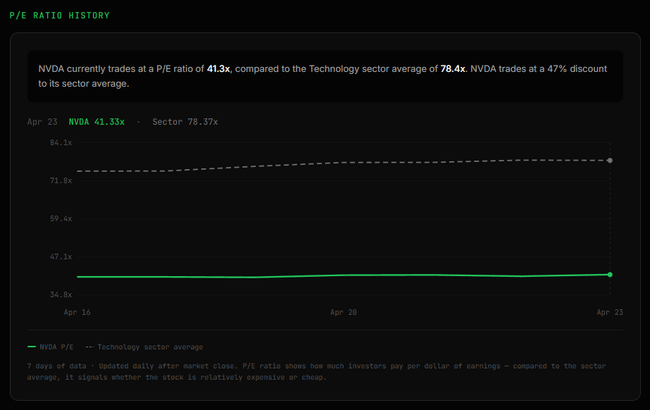
New on Fair Price Index — P/E ratio history chart.
Every stock detail page now shows how the P/E ratio has moved over time, plotted against the rolling sector average.
Why it matters: a high P/E in isolation tells you very little. What matters is where the stock trades relative to its peers — and how that gap is evolving. Trading at a 30% premium to the sector and widening? The market is pricing in aggressive growth. Trading at a discount that keeps shrinking? Sentiment is catching up to fundamentals.
Live now on fairpriceindex.com — free, no login required.